Tuesday, December 29, 2015

9 Answers for the FAQ - Why Doesn't My Google Analytics Information Match What My Vendor Is Reporting (Including DFP and Facebook)


I get this question several times per month. Why don't my Google Analytics numbers match my vendor reports, including Facebook and DFP (DoubleClick For Publishers)?
While Google Analytics is wonderful for understanding how visitors use your website, it doesn't track session data the same way that log servers track clicks. Sessions and visits and clicks are not measured in the same way because although in our minds and for basic reporting they are the same thing, in the techy underbelly of website traffic, they are not the same thing and are not measured in the same way.
If you don't want to get too geaky, you can stop here and know that it's ok. Industry standards show that a minimum 10-15% margin of difference is normal. It can be more if any of the issues in the super geaky section below apply to you. I have also heard many say it's up to 40% on Facebook reporting.
When you use a vendor that is trusted and that has years of experience with successful campaigns, you can rest assured that you are not being scammed. The top vendors work each day in the industry and with the IAB (Interactive Advertising Bureau) to maintain integrity among those offering digital marketing. It's not all a ploy to trick you. The reporting is just different - doesn't mean it's wrong. 
If you want to get mildly geaky, here is the basic reason:
1. Click data is based on ad server logs from the ad exchange(s).  Analytics data (such as Google Analytics) that measures sessions, etc, is based on cookies or page loads. Two different measurement sources. In order for Google to record a "session", the following needs to occur:
A. A click from an ad takes place and the browser is pointed to the advertiser’s landing page.
B. When the browser starts to download the landing page, there may be a request for several files at the same time, including JavaScript, CSS, images, video, audio, etc., including the Google Analytics tracking code.
C. The Google Analytics JavaScript file must first be downloaded and interpreted by the user’s browser.
D. The user’s browser/device and security settings must support:
• Cookies
• JavaScript
• Images
E. If any of the above are disabled, Google Analytics may not be able to record a session.
F. Next, the browser sends a separate request to www.google-analytics.com, the Google Analytics servers.
G. Finally, a session is recorded.
This alone is a big chunk of why sessions and clicks don't match in reporting. Your vendor gets and receives a click and they count it, it's that simple. But steps A-G above have to happen before Google Analytics records a session. 

Ad servers track clicks, while Google Analytics tracks sessions. (info obtained from Google Support.)


*****You could use a UTM code to help mitigate some differences as long as you remember it will still never match exactly. Click here for UTM code info.


And if you'd like to get super geaky, the following is information directly from Google Support and Vicimediainc.com

2. YOUR LANDING PAGE MIGHT REDIRECT TO A DIFFERENT PAGE

Redirects in landing pages can often keep the Google Analytics code from launching and properly identifying the traffic.

3. USERS MIGHT HAVE SET THEIR BROWSER PREFERENCES IN WAYS THAT PREVENT GOOGLE ANALYTICS USED ON WEBSITES FROM COLLECTING DATA

Users entering your website through a click might have JavaScript or images turned off, or might use other technologies preventing Google Analytics from reporting about your website users (such as by installing the Google Analytics opt-out browser add-on).

There is also more information from Vicimediainc.com here:

4. If a user comes to your site from an ad, and then leaves the landing page before the Google Analytics tracking code executes, then the “gclid parameter” is never passed to the Google servers, and that click is not associated with the session. The result is a clicks vs. sessions discrepancy.
5. If your Google Analytics tracking code is at the bottom of your web page and placed right above the closing of the body section then you are definitely at risk for reporting discrepancies. And, the bigger and heavier the page the more at risk you are. Why is this an issue? Because a person who clicks on your ad and bounces quickly will in all likelihood never trigger the Google Analytics tracking code lying at the bottom of your page code. One simple solution is to place your Google Analytics tracking code near the top of the page to minimize the risk.

6. A VISITOR MAY CLICK YOUR AD MULTIPLE TIMES.

When one person clicks on one advertisement multiple times in the same session, the ad server records multiple clicks while Google Analytics recognizes the separate pageviews as one visit. This is a common behavior among visitors engaging in comparison shopping.

7. 3RD PARTY IMAGES

Some browsers give users the option to disable images that are requested from domains other than the current page. Disabling such images will prevent data from being sent to Google Analytics.

8. 1ST PARTY VS. 3RD PARTY COOKIES

Even among cookie-based tracking solutions, there is a difference between 1st party and 3rd party cookies. Because 3rd party cookies are set by a source other than the website being visited, they’re often blocked by browsers and security software. Google Analytics uses 1st party cookies.

9. YOU DON'T HAVE YOUR GOOGLE ANALYTICS TRACKING CODE ON YOUR LANDING PAGE

This might sound like a no-brainer, but it happens too often that a landing page doesn’t contain the Google Analytics tracking code. If this happens, a click is measured, but no visit at all.
And here are some facts supplied by Facebook Support:
Facebook conversion measurement attributes conversions based on a 24-hour view and 28-day click through window. Any comparison you do against other tracking data must be within the same attribution model. 
Many 3rd party tracking providers use referrer URLs to credit conversions back to ads. Due to this method, these providers generally under-report Facebook conversions by about 40%. This is due to the fact that roughly 40% of Facebook users browse Facebook using HTTPS instead of HTTP. So when a user clicks on an ad on Facebook and converts on a site, the referrer cannot be recorded since the user left an HTTPS environment and entered an HTTP environment.


So in review:

  • A session is not measured the same way a click is measured.
  • You could be missing tracking codes (maybe).
  • The visitor may have disable some tracking metrics on their browser.
  • A shopper may click more than once if they are actively looking.
  • Your landing page may use a redirect.
  • Your tracking code could be too low on a heavy page. 
  • HTTP vs HTTPS in one visit


Tuesday, December 22, 2015

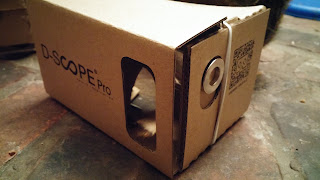
When the Magnet Washer Button Isn't Working, You Can Customize your Google Cardboard D-Scope VR for Galazy Samsung S3 (or any phone that has the magnetometer in a different place)

Why is the magnet washer "button" on our #Cardboard VR viewer not working?
Google Cardboard VR Viewer "D-Scope"

Our first adventure with #VR (virtual reality) and Google #Cardboard was coincidentally on a Galaxy Samsung S3. We have the D-Scope Pro but they are all mostly the same.
So we had some glitches with the washer "button" working and it took us a few minutes to figure out why. 
Was it us? How was it supposed to work? What should be happening, etc.
Turns out, the S3's magnetometer is on the other side of the phone. This makes using the washer button impossible where it is.
Happily, it is an easy fix!
The cardboard player is easily customized. This VR stuff is super fun, there are many free apps and Youtube video out there. 

Here's what we did.

The left side of the viewer has two layers of cardboard on it so it was super easy to take a knife and carefully cut only the top layer between the washer and the tape that is on the viewer to keep the sides folded. Cut the whole way across the top layer of the viewer and cut slowly so that you only cut the top layer. The image with the knife below shows just where to cut. 


We removed the cut piece and placed it on the right side of the viewer and UPSIDE DOWN. If you line up all images as shown, you are on the right track. Glue it firmly to the new side. 


Don't put the washer in place until the glue has dried.

Then carefully pry out the magnet circle from the inside left side.


You next place the washer in the uppermost position that you can in the oval cutout. Uppermost, not the bottom.
Put some glue on the magnet and place it inside next to where the washer is. They will hold each other in place.
Do not glue the washer. 
Do not let the washer get stuck in any glue overflow from when you glued the cardboard in place.


Because the magnet was in a slightly recessed area on the left side, we decided to make a simple brace for it on the new right side placement just so over time it didn't move.


The recess from where the magnet was originally. 
We took some small rectangular cutouts from the leftover Cardboard packaging and made the brace using two identical sized pieces, gluing them together and then gluing them in place. I won't have exact measurements for you because each magnet will end up a fraction of an inch differently here or there. 


Let everything dry, reinforce the left side of your box with some glue or tape and you are good to go.
Instead of pulling the button down to use it, you will slide it up. It's very easy. 
Oh, and don't let two washers touch if you can help it and if you have more than one viewer. The washers are also magnetized and we ruined our manicure getting them apart : )
Old and new together.

You can get your Cardboard VR player here. 


Friday, November 27, 2015

Have You Looked at Your Pinterest Analytics Lately? (Pinterest 101)

Are you aware that Pinterest has analytics to look at, too?
The client I am using in this example has been doing passive Pinterest for awhile on their own and we are going to add it to the mix of coordinated marketing that I will be doing for them so this Pinterest analysis is their first.

The analytics tab for Pinterest is very easily accessible right on your home screen. It's right out there on the left side.


Let's click on overview.


Here you will see the overview (hence the name) of your account activity.
First thing that most people need to do is verify their website (see the confirm site button in the upper right module).
Starting from the upper left, you see a snapshot of your average DAILY impressions and viewers. 
In the middle is average MONTHLY viewers and average MONTHLY engaged people.
Below this is the top performing pins for your account.

Let's look back at top left module (your Pinterest profile) and click on "more". This information is more detailed and has the 4 tabs across the top to review impressions, re-pins, clicks and all-time.
All-time shows your best performing all time pins, and references similar pins from other people that perform better in search and then also in all interactions. I really do believe that all of these tabs are really self explanatory so I will not bore you with details. Please contact me if you want more details on this.
Going back to the main dashboard, let's click on "more" next to Your Audience.
This is a bit deeper dive into the demographics that make up your audience. Please note the 2 tabs on top, Demo and Interests, This information is cumulatively used to help you get the best image of who your viewer/follower is and what will be of interest to them.

Now you can go back to the upper left corner of your dashboard, hover over Analytics and click on Profile. You will notice that it's the same info as the "more" buttons next to each module that we clicked before. 
As this is a 101 walk through, this is the time for you to simply gather the new insights that you now have into you Pinterest account, successes, and most importantly... who your followers are.
You should be developing your audience persona.
For example, if your main audience is women aged 25-35, then you should develop a persona based on this. Amy is one of the most popular names for women in this age group (a Google search will help you name your persona).
Get an image of a 30 year old woman. This is the face that you think of when you market to your persona.
Your audience persona in this instance, then. would be Amy. She is 30. You got some insights into what she is interest in from you Pinterest analytics. You can get more demo info from her from your Twitter Analytics and from your Google Analytics. Don't try to knock this project out in a half hour, develop your persona as you go along. Use the developed(ing) persona as your muse.


Tuesday, November 24, 2015

Have you looked at your Twitter Analytics lately? Twitter Analytics 101


Many people aren't even aware that Twitter Analytics are available to them.
In 2014, Twitter made their Analytics available to everyone, not just the top Twitter users.
While I don't recommend that my clients obsess over these metrics every day, I do suggest looking at them every two weeks. I look at them for my clients weekly. Twitter Tuesday : )

So how do you find your Twitter Analytics?
You can log into analytics.twitter.com with your Twitter account info. 
OR even easier for me is...
Click on your photo in the right side of your screen and the drop down includes Analytics as an option. 

When you click on it, you come to your Analytics dashboard with 7 tabs on top. 


Let's look at some of the most important metrics right here on the Home Tab.
Impressions are the number of times your Tweets were seen by people on Twitter. This is similar to the "reached" metric on Facebook. In itself, his number isn't terribly telling, but it does give you a good baseline to know how many times your Tweets are seen overall.

Engagements are the total time your Tweet was interacted with. So any clicks, shares, expansions, Retweets, username expansion, anything that a person would do with a tweet is measured here.
Your Engagement Rate is the number of engagements divided by the number of impressions. This is similar to click rate in more typical digital advertising. In it's self, it's not an end-all-be-all, but it's good for measuring higher interactions with specific tweets and starts giving you insight into what your followers enjoy.

Click on the Tweets Tab and you get more analysis about individual tweets. 
Clicks are visible on the right side of the screen. This measures the number of times that people clicked on a link in your Tweet. It is a great conversion type of metric. You can clearly see what your people are responding to with your content.
Clicking on any Tweet here allows some in-depth insight into each Tweet.

On this page you can also see your top tweets and top replies.
You also have the opportunity to promote tweets from this screen based on the engagement you received.

The Audience Tab is just what it says, a demo breakdown of your Audience. 

Twitter Cards allow you to attach rich media experiences to Tweets about your content; Twitter Card Analytics gives you related insight into how your content is being shared on Twitter.
We'll cover Twitter cards in another post. Its more 102 than 101.

The Video Tab gives insight into your videos. 

The Events Tab shows you events that are trending on Twitter and gives you the ability to run Promoted Campaigns based on those events. We will cover that in Twitter 103.

The Tools Tab will be covered in Twitter 104. Let's focus on all of the new insight that you have right now : )
How To Digital focuses on explaining digital marketing in English. The end goal isn't to turn you into a tech geek (not that there's anything wrong with that). Our goal is to help everyday people understand digital marketing in small and manageable bites.
Did you know Pinterest has Analytics, too? Click here....


Monday, November 23, 2015

Getting Different Keyword Results Than You May Be Used to from Your Onsite Search Bar and Google Analytics

This week I am starting a keyword list for a client interested in adding more marketing to their mix.

I accessed their Analytics and found the keywords most frequently used to get to their site through organic and direct traffic. 
This, and brainstorming with the client/sales team/ marketing teams, is one of the best ways to nurture a brand new keyword list. 

Let's, how-ever, look at a way to go a bit deeper.

What about the keywords that people search for once they are already on your site? If they typed words into your search bar, this tells you a few things.

1. They came to you thinking you'd have this information. (why do they think this?)
2. They couldn't find it right away, so they searched and found it. (maybe think about the results of this and making navigation to the subject better if you get enough searches).
3. They couldn't find it. You don't have it. Maybe you should (maybe)?

So how do we tap into this often over looked list of keywords?

First, do a search while on your site in your search bar. Look at the URL of the result that you get and choose a unique identifier that you can use to identify this in Google Analytics.
For example, a site search in the search bar of one of my clients returned a result that had this sequence in the URL. www.CLIENTSITE.com/search?searchTerm=camels.

(I searched for camels. It's my favorite random word).

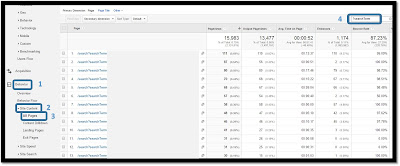
Open your Google Analytics. Click on Behavior, Site Content, All Pages.

Paste the unique identifier from the search result returned from your search bar query on your own site. Not the whole URL, just the unique-to-your-search-results-page identifier.

For example, I tried the whole part after the / which was search?searchTerm and came up with no results in Analytics.

****Be very careful that the UI (unique identifier) that you use can not appear anywhere else on the site.

So I used just used ?searchTerm and BINGO. There were my results. 

Click on image for larger view
The actual keyword phrases returned in the example above were removed to protect client info.

I will be optimizing their site to these words, making navigation to top searches more obvious on his site, and we're pontificating over whether to add 3 of the items that people assumed they had which is why they went to that site and then searched for those things.
Of course, it's the public, so they searched for things that we have deemed not necessary to address.

This is a great way to get access to some different information and customer insights.

Let us know what you find. We're all better when we share.


Friday, November 20, 2015

Adding Conversions or Goals to your Google Analytics to Measure Form Completions (like contact us) or File Uploads

Adding goals or conversions is something that every person with Google Analytics should do. This applies to pretty much every web site regardless if it's an e-commerce site or not.

Why should you care about goals? Because at some point you will do something to promote your website. Even if it's as simple as linking to your site from Facebook. Or as complex as paying for advertising through a vendor or paid campaigns on your own. You will somehow market this site.

Conversions (goals) will show you which methodology that you used gave you the best return for your investment of money and/or time. 

First we have to decide which metrics will work best for you. If you have an eCommerce site, it's pretty easy to pick your first goal. You will want to measure revenue. The second most common thing to measure is people taking action such as filling out a form for more information, or signing up for an email blast.

Even if you have none of these goals on your site, you can decide on metrics that will help you measure the value of each site visit. Maybe you know that if they visit more than 3 pages, they are serious. Maybe you want to know if the visitor watched a video. We will address these conversions in our next posts. 

For today we are going to set up conversion monitoring for people that come to your site and fill out a form or uploaded files (the second part is rare for newbies). 

You do need to make sure that you have a Thank You page that shows to people upon their completion of your forms. I still have clients that use more old school web platforms that are set up to NOT redirect to a separate thank you page. Fortunately most that I have seen were able to adjust their settings and make it direct to a thank you page.
What if you don't have a thank you page? I have been asked if you can just measure traffic to the email sign up page itself. Yes you can BUT you won't know if people got to that page and then dropped out before completing anything. This is not a true metric for success. If you got 15 people from Facebook to go to that page, and 4 people from Twitter to go to that page.... and 3 of the 4 Twitter people actually complete the form and only 1 from Facebook does, then Twitter is really worth more of your time and you won't know that from just traffic.

So now we are going to set up the goal in your Analytics. If you don't have Analytics yet, click here.

Sign in to your Google Analytics account and click on Admin. 
On the right side of your admin page will be a list of options and you are going to want to choose "Goals". 


Click on New Goal


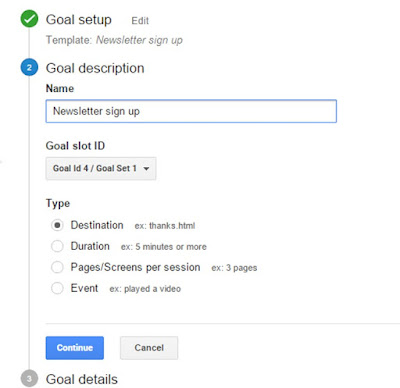
Select Newsletter Submit (uploaded a file or completed online form)


Add your campaign description. If you have more than one newsletter or sign up spot, make this name unique to that form. Select Destination as your type and the continue button. 


Here's where you add the exact URL address of the Thank You page that you are measuring. Copy-pasting it from your web browser is best practice. 


For the time being, we will not use the Value tabs. That's for a bit down the road when we have gotten better at Analytics and our Goals. 

Click save and you have done it! It brings you back to your Goals list. If you go into your Analytics, especially under acquisitions, you will notice the conversion columns (last 3 columns on the right) and over the next few days your site traffic will start being measured against the goals completed in addition to your every day traffic numbers.
Soon you will know how many goals are completed and how those people got to your site.


You will also be able to measure conversion rates if you chose to use UTM codes to help distinguish between vendors or advertising methods. 

It may be very tempting to plop a whole bunch of new goals in right now, but please try to wait. Too many goals and metrics will water down the value of what you are trying to do. 
Down the road we will be adding values to these goals and you need to stay organized and understand how each of these goals impacts your business. 

At this point, only add additional goals if you have additional news letter or forms on your site. Stop after that for today and let the numbers start processing. 
Your next thought should be what the value is of each person on your email list. Do you email regularly? Do you know what your email open rate is? Do you know how many people respond to offers that you email?
We'll cover this in future blogs, too.

For now... CONGRATULATIONS on advancing your marketing skills and becoming that much closer to really making a difference in your business!

Let us know how you did~


Tuesday, November 17, 2015

Removing the Facebook Review Section from your Business Facebook Page

An interesting question was asked of me this week. "How can my client remove their review section from their Facebook Page?"
I don't typically recommend taking the review section out. I am a staunch advocate of handling reviews correctly so they are not only not a problem anymore, but so that they help you. That being said, I have clients who aren't at that point yet. Plus I wanted to know how to remove the section just because.

I didn't think it was going to be tricky until we looked into it a bit. 

Turns out you can't just remove the Facebook Reviews Section. 
There are two work arounds that we found.

1. Remove the maps from your page. For some reason, this makes your review section not appear. Transversely, if you want a review section but aren't using your full address or map, you won't get a review section. This is something for people running businesses from their home to consider.

2. Change your page category to a non-business category.

**We would really love to hear from you if you know another method. As of November 2015, this is what we know.

For most clients, we are opting to change the business category over removing the map. We feel maps can be important for future clients and haven't seen any negative things occur with the changed non business category. Here are the two ways to do it.

To remove the map you do the following:


1) Click manage pages under the little drop down arrow in upper right corner.
2) Click on "About" then "Page Info" then "Address".

3) Click “Edit” on the right side of the “Address” line.4) Under the map un-check the box that states “Show this map on your Page and enable check-ins.”.

5) Click “Save changes”.

The Reviews Section should now be removed from your Facebook Page.
To change your catagory:
1) Click manage pages under the little drop down arrow in upper right corner.
2) Click on "About" then "Page Info" then "Category".
3) Click edit next to Category and make your site a non business category. 
In our example here, we have the full address with box checked, but made the category non business and reviews still went away.
No review section even with address and map.


Review section appears because both category and business are completed.

Properly handling reviews is coming in future posts. Please follow us to keep reading more.

Friday, November 13, 2015

Getting Google Analytics Code for Your Website to Track Your Site Traffic

Every person should be tracking information for their site. Do not rely on a vendor or your "web guy". If your relationship changes with either of them, you may lose access to your own site history. At some point, you will wish you had it.
Even if you don't think you will use this information for months.... just get it set up so that your history starts building.

First things first. Make sure you have an Anayltics account. If not, sign up and get one under your everyday Google account information. 

Next sign in to Analytics and click on Admin at the top.
Click the drop down arrow next to Accounts. Choose the bottom option "Create new account"

Choose website, name your account (business name is best here) add your website name (some businesses have multiple sites, so you can distinguish various sites here), copy/paste your URL, choose your industry and time zone.

Image from Google Support https://support.google.com/analytics/answer/1032385 


Click on the get tracking ID button. Copy/paste the entire square that they give you and now you have three choices.
1. Send this code to your website developer or handler and have them add this to every page of your site. If you have a "web guy", they will know how to do this.
2. If you handle your own site, go to edit mode for your website and choose the option to add HTML. Paste the code into the HTML box and save it. Make sure it's on all of your pages. 
3. If you don't have a "web guy" and you can't figure it out on your own, you will need to "call a techy friend" or contact support for where ever your site is being hosted. Each site is so different that I can't give you one simple answer here. 

If you have used choices one or two, you are done. 
Over the next few days, your Google Analytics will start populating information.
We'll review what to look for in future posts.


Amazon Deals